- The Trader Reset
- Posts
- SPX Outlook
SPX Outlook
And a New Stock for the Month of July!
SPX Outlook
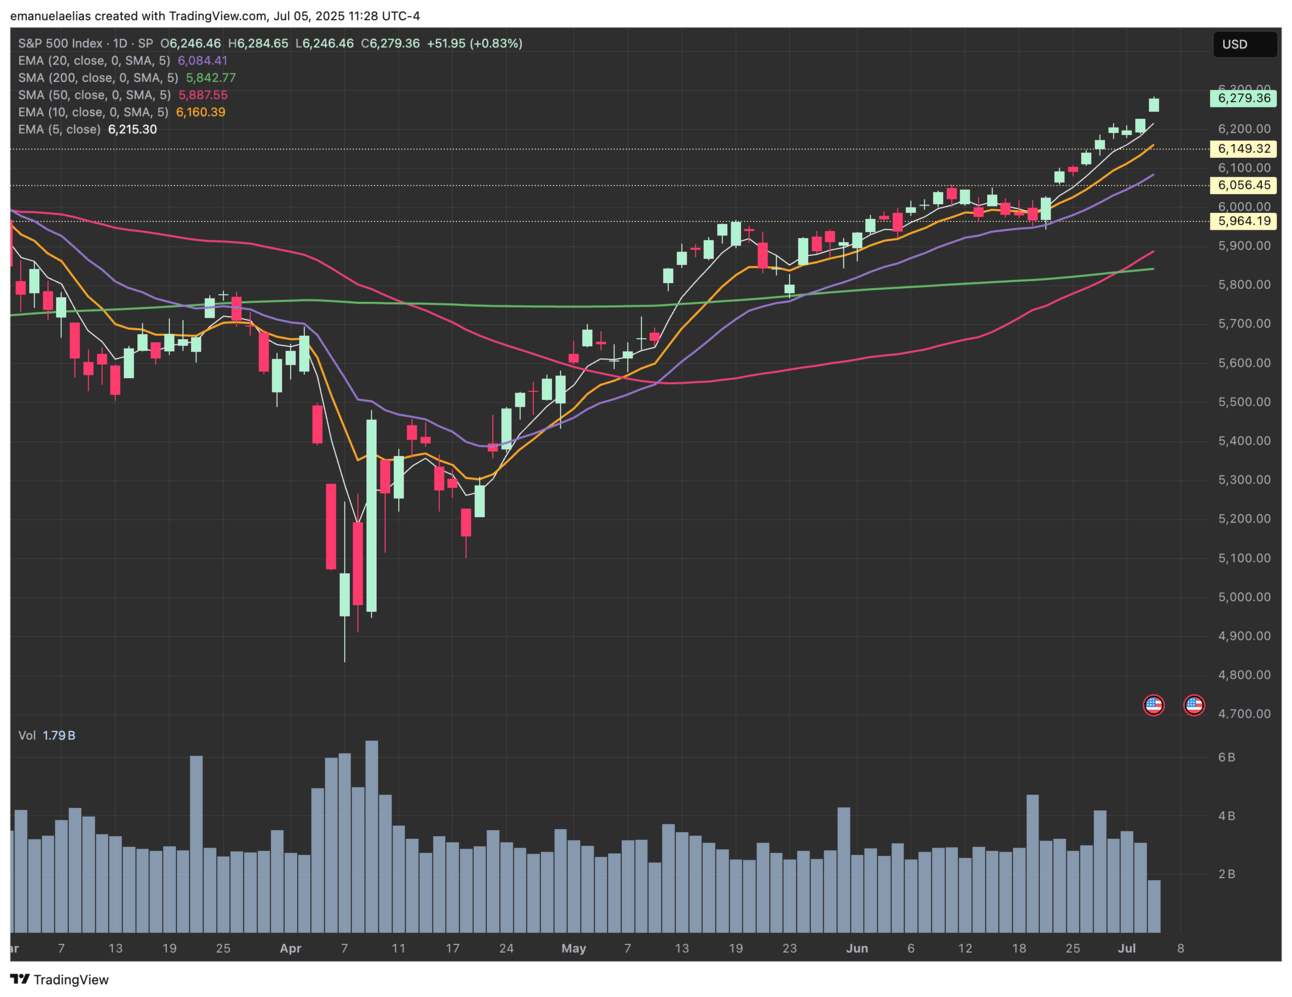
The S&P continued to climb last week and pushed into a new all-time high. I added the 5EMA back to my chart (white line) because when a trend is strong, price tends to trail along this moving average.
With no overhead resistance, we may keep climbing a bit longer, though eventually we’ll need to digest the move, whether through a deeper pullback or a longer base. If we continue higher from here, I wouldn’t be surprised to see a couple of red candles, like a 1–2 day breather, to break up the move. A short pullback doesn’t mean much by itself, but it’s important to stay aware of when momentum starts to tire. That’s when pullbacks can turn into chop or a deeper decline.

SPX Daily Chart
Here’s what I’m watching this week:
New All-Time Highs
Woohoo! SPX closed at 6,279.36, marking a new all-time high. With no historical resistance above, trend continuation is structurally supported while price holds above key short-term moving averages.Trend Strength
Price is currently riding the 5EMA, consistent with a stronger momentum phase. No deviation from strong trend behavior has been observed yet.EMAs and Support Levels
The 10EMA, 20EMA, and 50SMA are all rising and properly stacked, a setup that supports bullish continuation. Nearest support zones:
• 6,149 (prior resistance)
• 6,056–5,964 (consolidation zone pre-breakout)Volume and Price Behavior
Price has been rising on stable volume. If volume starts to fade while price continues to rise, the probability of short-term stalling or retracement increases.Expected Pullback Scenario
If SPX pulls back, a 2–3% retrace would remain within normal bounds. Price action holding around the 10EMA or 20EMA would still keep the shorter term uptrend intact.Strategic Note & Caution
If the trend holds, shallow pullbacks may offer clean entries. But a break of the 20EMA with volume, would be the first sign to reassess. If that happens, I’d watch for a test to the 50SMA.
July’s Stock: PYPL
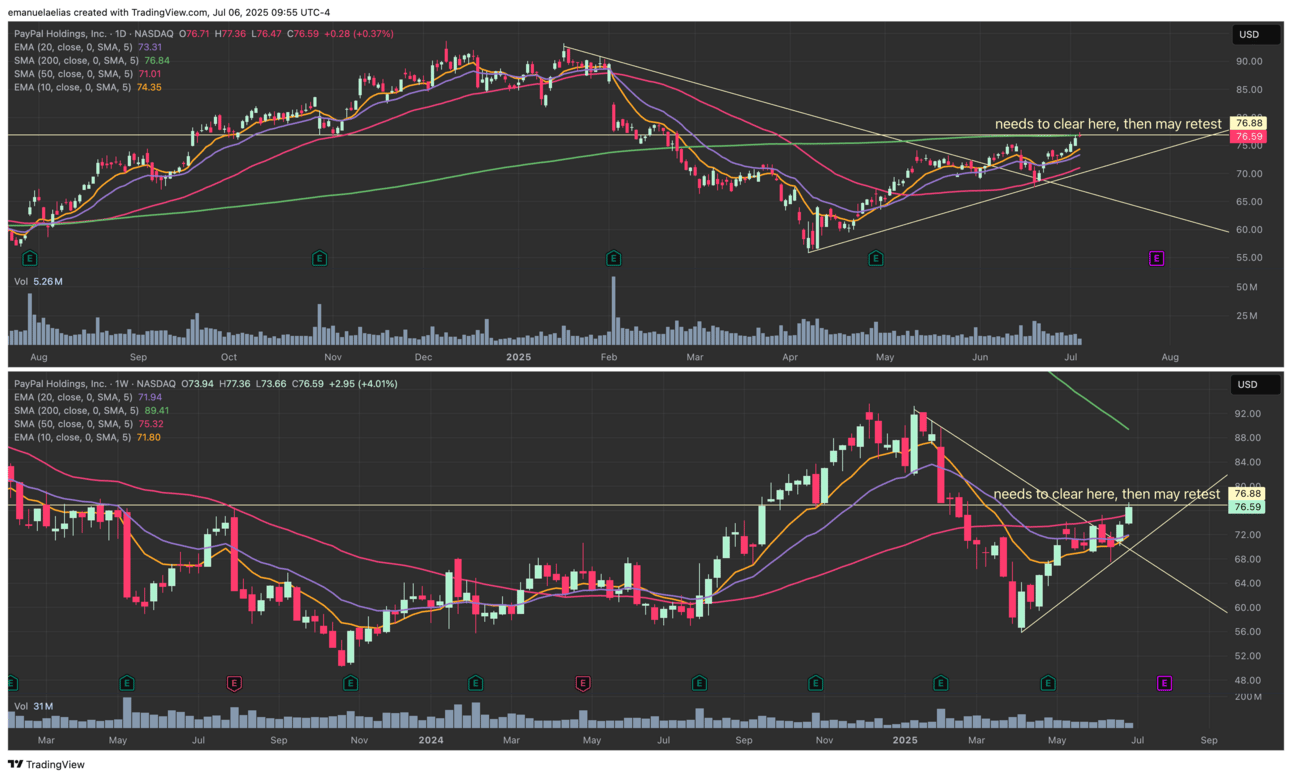
PayPal has made it back to my trading list. Steadily climbing since April 7th, it has now cleared a few meaningful levels on the weekly chart. Structurally, it’s already in an uptrend, and is now approaching a zone that, if cleared, could open the door for continuation. Imo, it has room to go.

PYPL Daily and Weekly Chart
Here’s what I’m seeing:
Weekly Uptrend Confirmed
After a clean consolidation from mid-May through mid-June, PYPL broke out of a weekly range and has now been rising. That long lower wick from the week of June 16th was bought up and held, confirming buyer interest.
Earnings on Deck
Earnings are scheduled for July 29. Stocks that are announcing earnings often experience an increase in momentum 2-4 weeks before and/or after their earnings call.
Key Level Overhead
The area around $76 - $77 is still a short-term ceiling. This level was a retest area for the rise in 2024 and where price stalled in February before declining further. It is also the level of the daily 200SMA. Clearing this could provide a longer leg up.Potential Entry on a Retest
If PYPL does break through the 200SMA with some strength, I’d watch for a retest back toward this level. If it pulls back first, I’d look for an entry on the hourly chart in the $74-$74.5 area.
Weekly 50SMA Reclaimed
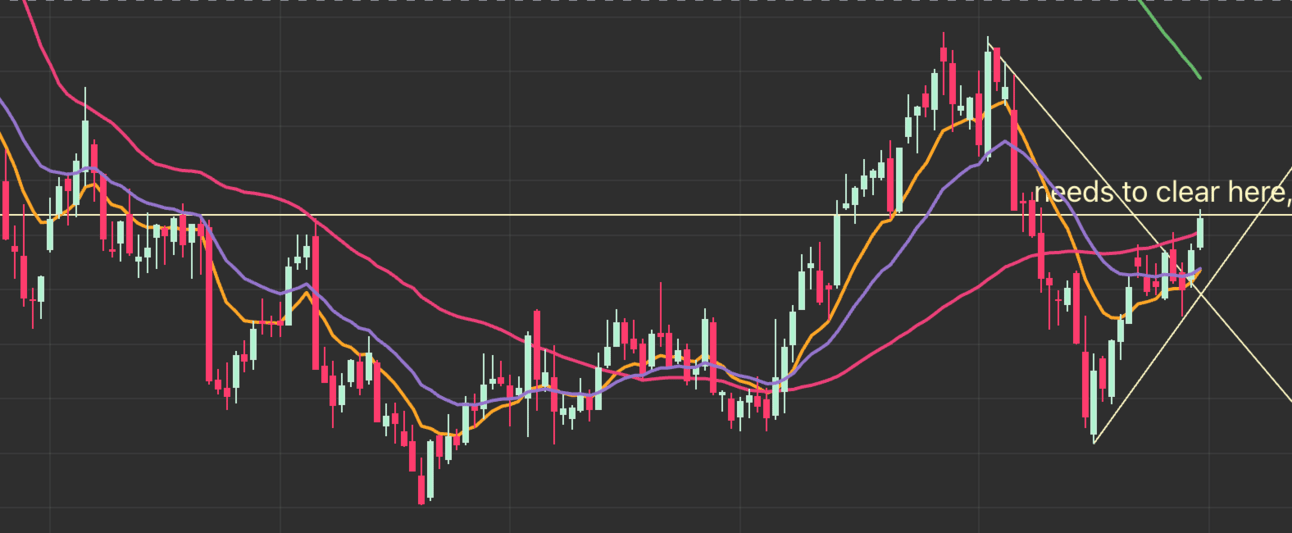
I become interested in trading a stock when it closes above its weekly 40SMA or 50SMA and starts to build above it. This signals that we may be back in bullish territory.
In PYPL’s past scenario, you can see that the price stopped declining, then started to flatten, and weaved above and below the 50SMA until it broke above (on the right side of the base) and held. The stock then had a great run up. After the decline earlier this year, PYPL found a bottom, and started to base below the 50SMA. It has now popped back above it again.

Weekly Chart Snapshot
There have been a few great early entry points on this stock, and it could be just getting started. If the rest of the market is strong, there may be a pullback entry as early as next week on the hourly or daily chart time frame.
This week, I will be looking to close trades that are becoming extended (significant space between the price and the 10EMA) because that usually means the end of a leg of movement for my trading style. I’ll also be monitoring my new positions, like DE and ACHR, which seem to have room to go.
As always, thank you for tuning in! Oh and P.S. here are the most current standings in the U.S. Investing Championship, can you find me on the list? 😉