- The Trader Reset
- Posts
- Road Trip and Charts
Road Trip and Charts
A peak into some fun! Plus SPX and AVGO analysis
Last week I went on an amazing road trip with my partner and pup to Philadelphia, Pennsylvania for a wedding, and then back home. I had sooo much fun I wore myself out and caught a bug. I have been under the weather since Wednesday! 🥴 🤧 🤒 So I thought to just leave you with:
The market may go up, it may go down, it may do nothing, good luck!
😂 But instead, here are a few photos from my road trip, and then I will break down the SPX and one of my players this week: AVGO.
Road Trip to PA
Our home base is Morrisville, NC. From here we did:
Lynchburg, VA (a quick dinner stop) ➡️ Lost City, WV (2 nights for hiking and exploring) ➡️ Philadelphia, PA (2 nights for the wedding!) ➡️ Washington, DC (1 night to walk DC and eat!)

Sign says: almost to heaven. Top of our hike in Lost City, WV

June contemplating life at a pizzeria in Lost City, WV

Wedding day! Going into the gorgeous venue for a night full of fun and dancing!

An incredible carousel for all the wedding guests!

Winding down: last morning at the AC Hotel Downtown Washington, DC
It was an amazing trip and I wore myself out. Quoting Billions here: WORTH IT.
(Anyone else a BILLIONS fan? It’s one of my favorite shows.)
SPX Review and Outlook
EOW Stats
High: 6,671.82
Low: 6,551.15
Close: 6,664.37
Weekly Change: +1.22%
New ATH: 6,671.82
I’m bringing in last week’s markup one more time before I clean up my charts. The daily uptrend line I anchored from September 2 ended up working more as a guide than an exact level, which is a great example of how to use trendlines. These lines are drawn from real data points, but there’s always some subjectivity. Sometimes price regards them exactly, sometimes it drifts nearby, and every once in a while it will break through completely. The point of trendlines is to help frame the general path and to see if price is respecting the trajectory or not.
What was hit spot on was the June–August uptrend line and the 10 EMA. Where they converged is where Wednesday’s shakeout tapped and then recovered, giving the index its springboard for the move higher. From there, SPX continued to push up, trailing just under that September daily uptrend line I had drawn in.

Last Week’s SPX Daily Chart Markup
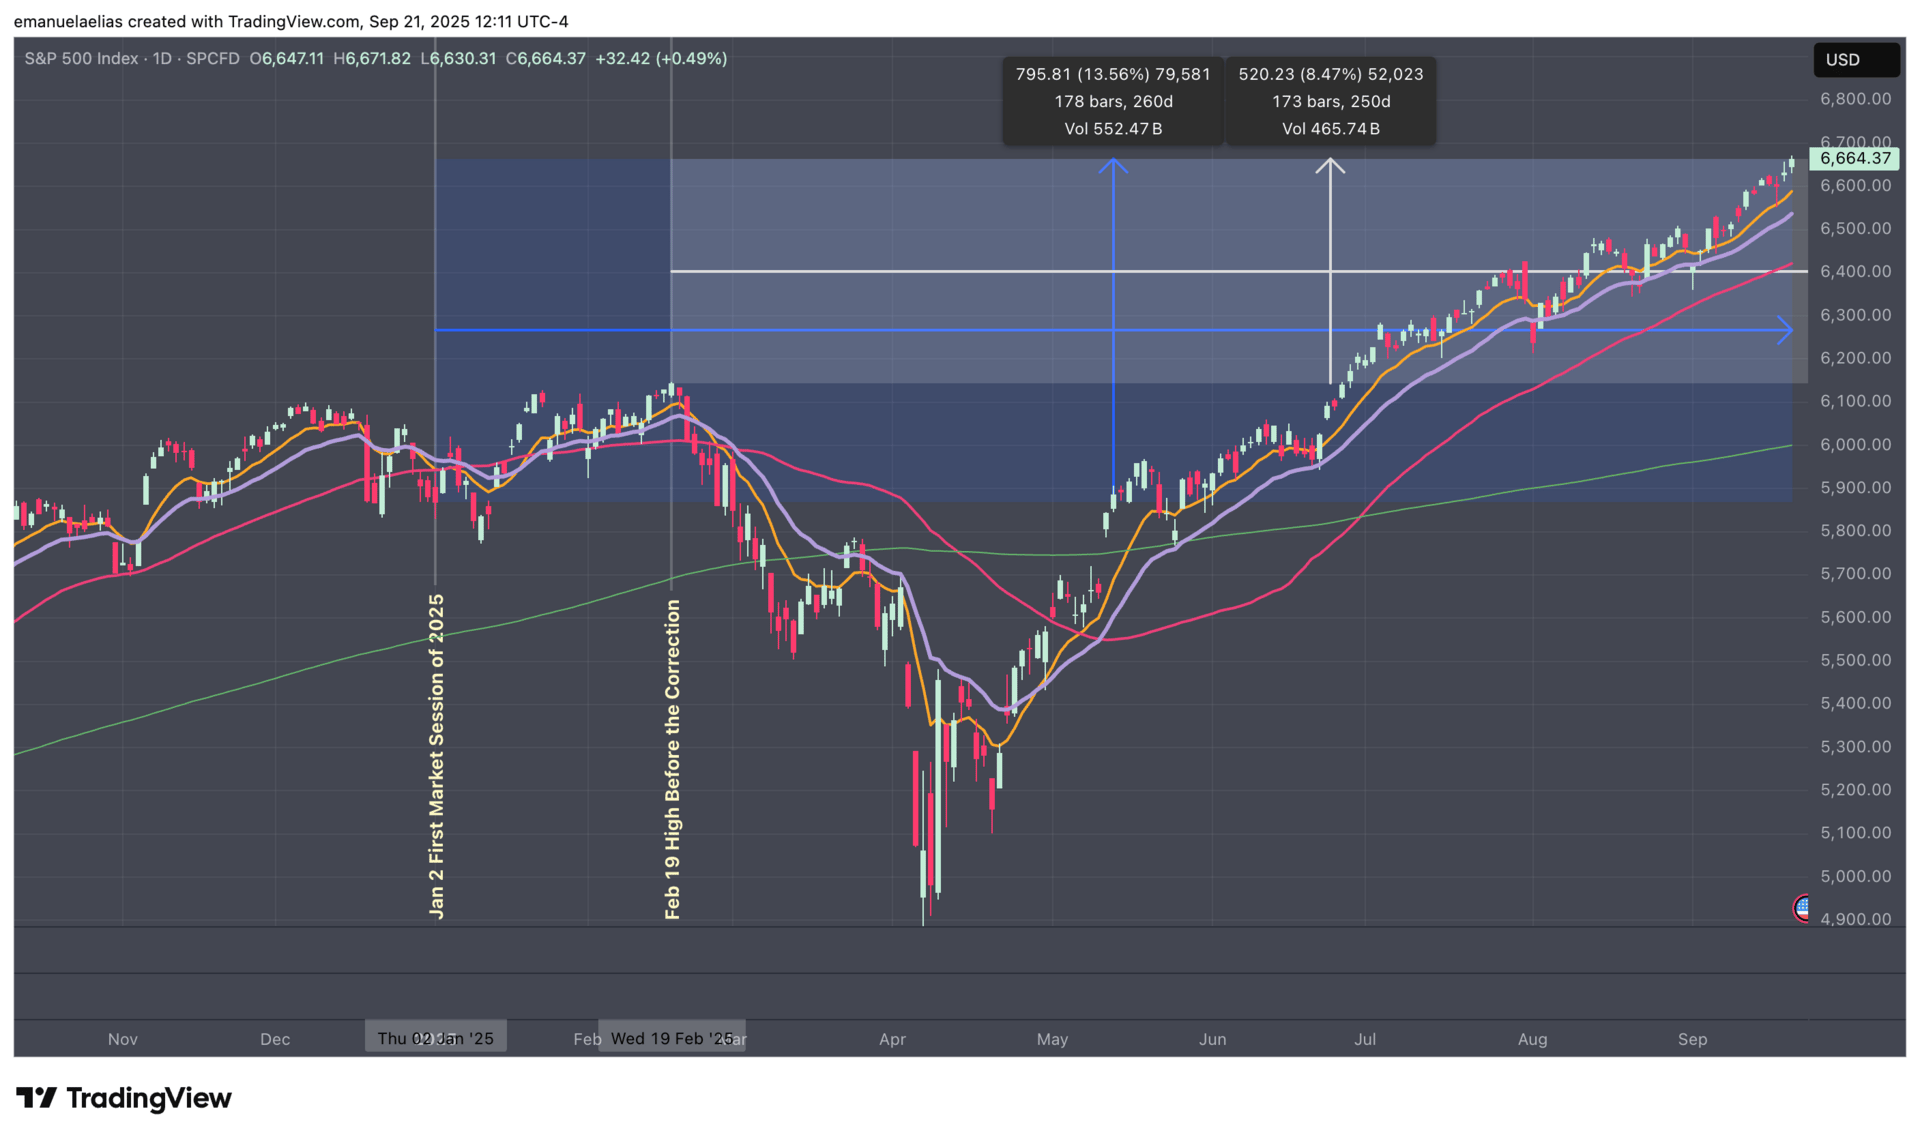
Before getting into scenarios, I did want to bring in a zoomed out view of SPX gains this year. Even though the market has been trending higher since the February correction, overall gains for 2025 are just over 13%. I also overlaid a second box from the high in February, and since the high in February, we have climbed about 8.47% from there. I mention this as I can see us having more room to go.

Percentage Gains YTD for Context
Now, I’ve freshly marked up the SPX daily chart so we can see it with less noise.

New SPX Daily Chart Markup
A few paths I see:
A pullback that takes us toward ~6,550, which lines up with the May uptrend line, the rising 20 EMA, and last Wednesday’s shakeout. SPX has tested the 20 EMA several times this year, sometimes briefly undercutting it before buyers step back in.
On the lighter side, we could see another quick shakeout like Wednesday, one to three days at most, that tags support near 6,600, the daily uptrend line, or the 10EMA again before momentum resets higher.
Sideways is also on the table, but maybe still holding above/around the 10 EMA. Possibly just hovering around 6,625 which was the rejection zone from this past week.
Mood: Bullish
The way buyers stepped in last week at the 10 EMA and June–August uptrend line shows there’s support underneath, and as long as that continues, the path of least resistance is up. I think the index will keep pressing higher with a few shakeouts or minor intraday and daily pullbacks along the way, but will remain open to what the week actually brings.
AVGO
AVGO is one of my players this week. I’ve got a small position on it already, but have been holding back, seeing if it needs more time to digest its gap up or if it’s ready to go. I did like where buyers stepped in last minute at Friday’s close. I saw that same last minute rush of buyers on several of my names, but nowadays I don’t know if it’s legit or the algos.
My interest in AVGO started when I saw that the daily timeframe may have been done declining (see Wednesday 9/17 where price starts to hold).

AVGO Daily Chart Snapshot
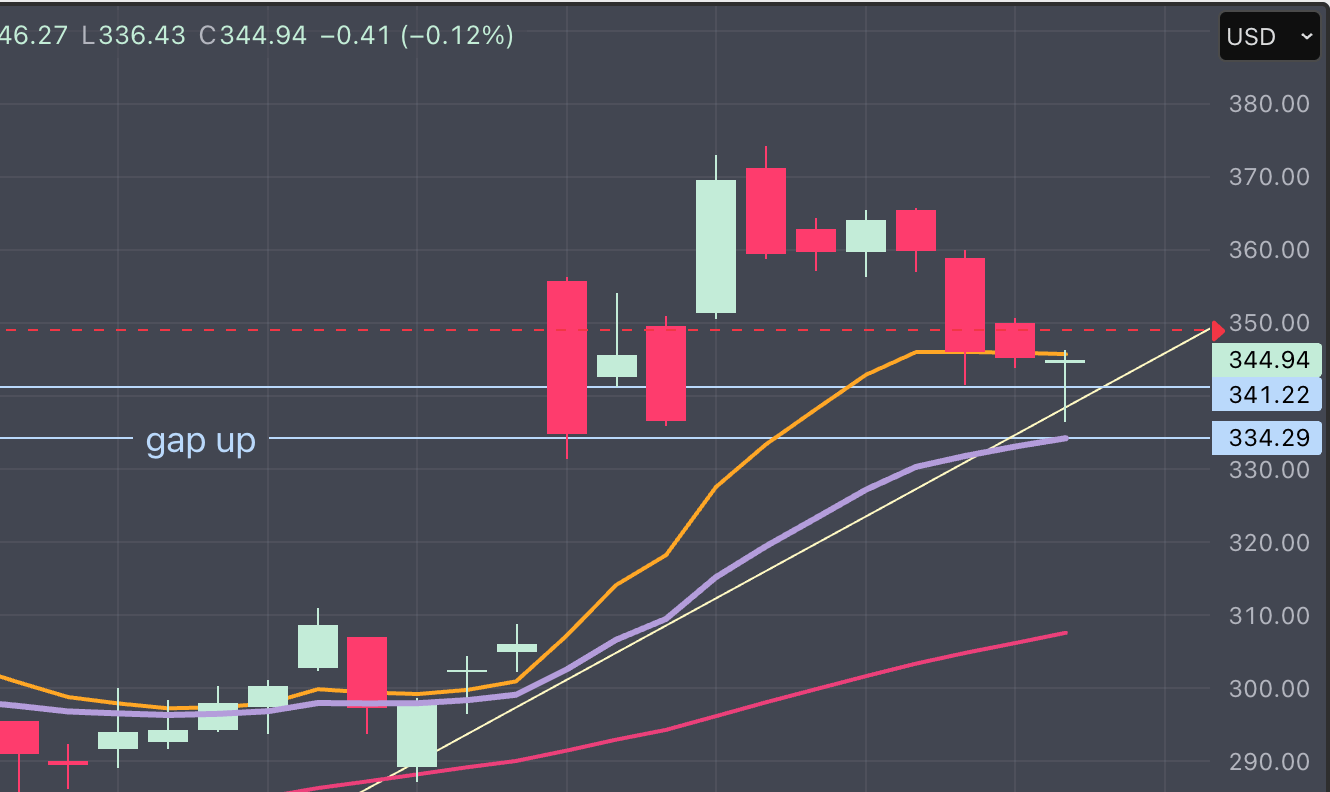
We can see more details here on the hourly:
Price has gapped up 3x consecutive times
Price drifted down to retest the second gap up level around 341
At 341 price found support
Price has now has popped above a short-term downtrend line I have drawn

AVGO Hourly View for Details
I will consider adding more if I see price rise above the hourly 10EMA and start trekking up. Now, it issss possible that AVGO could gap up again and if so, I’d have to wait and see if I get another chance to enter. Let’s see what the market gives us this week!
And that’s a wrap! Just a reminder to always do your own homework and trade what feels clear to you; I only share what I see on the charts to the extent of my knowledge and experience which is far from a newbie, but not yet a pro. ‘Til next time!